


Since the Clean Air Act was enacted in 1970, particulate pollution (PM2.5) in the United States has declined by 64.9 percent—extending the life expectancy of an average American by 1.4 years.[1] The country’s average pollution has been in compliance with its national air quality standard (12 µg/m³) since 2001 (See figure 4). Despite this success, the latest scientific evidence on the impact of pollution at even the low levels that exist in much of the United States reveals that 96 percent of the population are living in areas with unsafe levels of pollution. While there is potential for further progress, the United States still has low levels of particulate pollution compared to many other parts of the world—making the health impacts from reducing particulate pollution small in comparison.
KEY TAKE-AWAYS
- Particulate pollution shortens the average American’s life expectancy by 3.6 months or a total of 99.2 million life years relative to what it would be if the World Health Organization (WHO) guideline of 5 µg/m3 was met.
- In terms of threats to life expectancy, particulate pollution in the US ranks higher than diseases and illnesses like HIV/AIDS and child and maternal malnutrition.
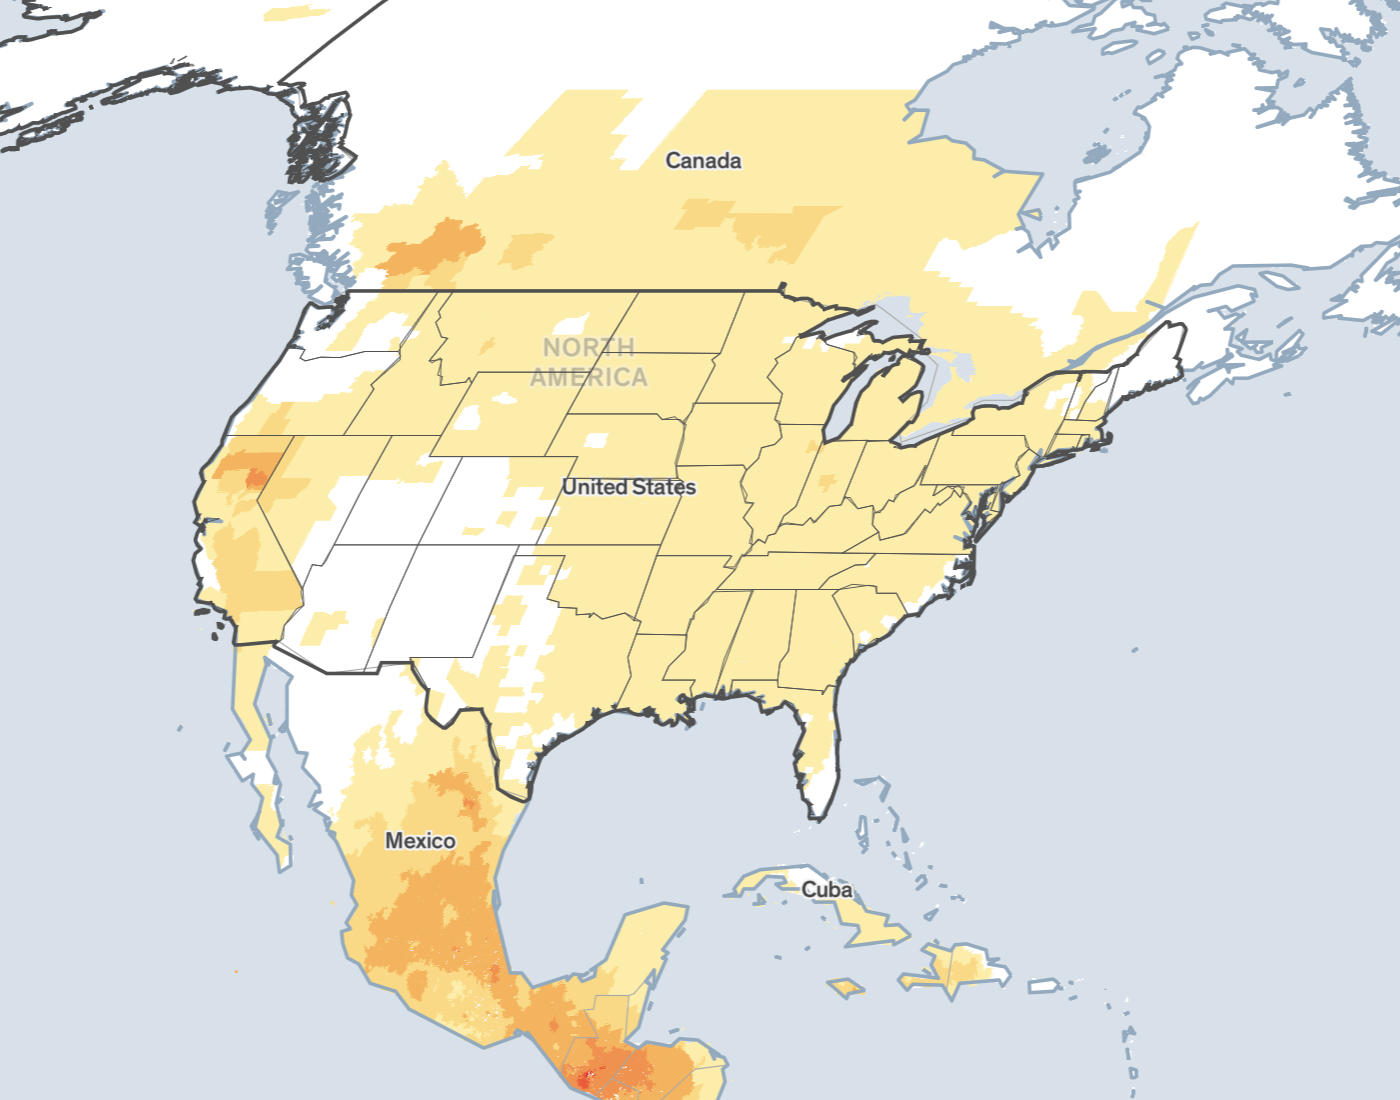
- The largest benefits from improved pollution in the United States are concentrated along the West Coast where more frequent wildfires have increased pollution in recent years. Residents of California’s Central Valley are now consistently exposed to average particulate pollution levels above both the WHO guideline and the nation’s own air quality standard of 12 µg/m³.
- In 2021, 20 out of the top 30 most polluted counties in the United States were in the state of California. In Plumas County—the most polluted county in the country—residents would gain 2.1 years of life expectancy if the region met the WHO guideline.
Related News


What the Supreme Court’s EPA Ruling Means for Air Pollution — And Your Health

Pollution from California’s 2020 Wildfires Likely Offset Decades of Air Quality Gains

United States: Clean Air Act (1970)
With 64.9% less pollution, Americans are living healthier, longer lives.
Reductions in particulate air pollution alone, thanks in large part to the Clean Air Act, have added 1.4 years to the life expectancy of the average American since 1970.
Learn MoreFor media requests regarding our United States Research, please contact:

Vicki Ekstrom High
Senior Director, Communications & External Engagement (EPIC)