Policy Impact
United States: Clean Air Act (1970)


With 64.9 percent less pollution, Americans are living healthier, longer lives. Reductions in particulate air pollution alone, thanks in large part to the Clean Air Act, have added 1.4 years to the life expectancy of the average American since 1970.
Today, particulate air pollution is not a major problem in most parts of the United States. But that wasn’t always the case. In the 19th century, the coal-driven Industrial Revolution was largely uToday, particulate air pollution is not a major problem in most parts of the United States. But that wasn’t always the case. In the 19th century, the coal-driven Industrial Revolution was largely unfettered by concern for health or the environment. Research continues to raise our estimates of the severity of air pollution in those times. Then, following World War II, American industry rebounded from the Great Depression, the population grew as the “baby boom” generation was born, the first highways were built, and droves of Americans fled for the suburbs for new homes outfitted with modern appliances. With home and industrial energy consumption increasing, and more vehicles on the roads, pollution began to increase.
The impacts of this intense pollution began to make their mark. In 1948, an episode of heavy smog in the industrial town of Donora, Pennsylvania killed more than 20 people and made half the population severely sick in less than a week. More people died the following months and higher-than-usual mortality rates continued in subsequent years.

The Donora Smog is an extreme but vivid example of how industrialization was largely unfettered by concern for health or the environment. Over time, it caused Americans to wake up to the fact that everyday pollution levels across the country were hazardous to their health. By 1970, Ohio’s Hamilton county had particulate pollution concentrations similar to those in Beijing today. Los Angeles had become known as the smog capital of the world, and other large metropolitan areas weren’t far behind.
The Policy
Now a part of everyday life for many Americans, citizens had enough. Millions across the country marched for a cleaner environment on the first Earth Day in April 1970. Just months later, Congress passed the Clean Air Act. This landmark legislation
- Established the National Ambient Air Quality Standards (NAAQS), setting maximum allowable concentrations of particulate matter, among other pollutants.
- Created emissions standards for pollution sources, leading industrial facilities to install pollution control technologies and automakers to produce cleaner, more fuel-efficient vehicles.
- Required each state government to devise its own plan for achieving and sustaining compliance with the standards.
At the same time, the federal government formed the Environmental Protection Agency (EPA), tasked with—among other authorities—enforcing the Clean Air Act in partnership with state, local and tribal authorities. The agency does so by certifying new facilities and vehicles, inspecting them periodically for violations, and taking the owners to court if they don’t pass inspections. Such lawsuits not only require them to begin complying with regulations, but also that the company pay fines and contribute to environmental mitigation projects.
Since 1970, the regulations and standards originally established by the Clean Air Act have been updated several times to reflect technological advancements in emissions control and an Since 1970, the regulations and standards originally established by the Clean Air Act have been updated several times to reflect technological advancements in emissions control and an evolving understanding of what levels of pollutants are safe.[1] In these decades, other environmental policies, and economic trends, though not originally aimed at air pollution, have had positive spillovers to air pollution. This has aided compliance with the Clean Air Act. In the early 1990s, for example, the Bush administration sought to curb acid rain. Its solution was to implement a cap-and-trade system for sulfur dioxide, which is also a source of particulate matter. Local regulations and the shifting of relatively dirty industries abroad for reasons besides environmental regulations have also helped, but the Clean Air Act has been a primary cause of improvements.[2]
The Impact
The Clean Air Act quickly made an impact on the quality of the air Americans breathed. By 1980, control of industrial emissions had led to a 50% decrease in particulate emissions, or a 20% decrease in ambient PM concentrations across the country. Today, on average, the PM2.5 pollution that Americans are exposed to is only 35.1 percent of what it was in 1970.[3]
With less pollution in the air, citizens are living healthier—and longer—lives. For example, in the former smog capital of Los Angeles, PM2.5 particulate pollution has declined by 57 percent since 1970, extending life expectancy for the average Angeleno by 1.5 years. Residents of Cook County, where Chicago is located, have gained 1.6 years on average, while residents of Washington DC, have gained 3 years of life expectancy on average.
Smaller towns and cities, home to industries which for decades prior to 1970 seemingly operated with little or no regard for pollution control, saw some of the greatest improvements. In 1970, Smaller towns and cities, home to industries which for decades prior to 1970 seemingly operated with little or no regard for pollution control, saw some of the greatest improvements. In 1970, residents of Mobile, Alabama could have expected to lose 4.7 years of life due to air pollution, relative to if the air met the World Health Organization guideline of 5 µg/m³ for the safe level of particulate pollution. Today, pollution in Mobile is down by 84.6%, which almost brings them at par with the WHO safe guideline threshold.
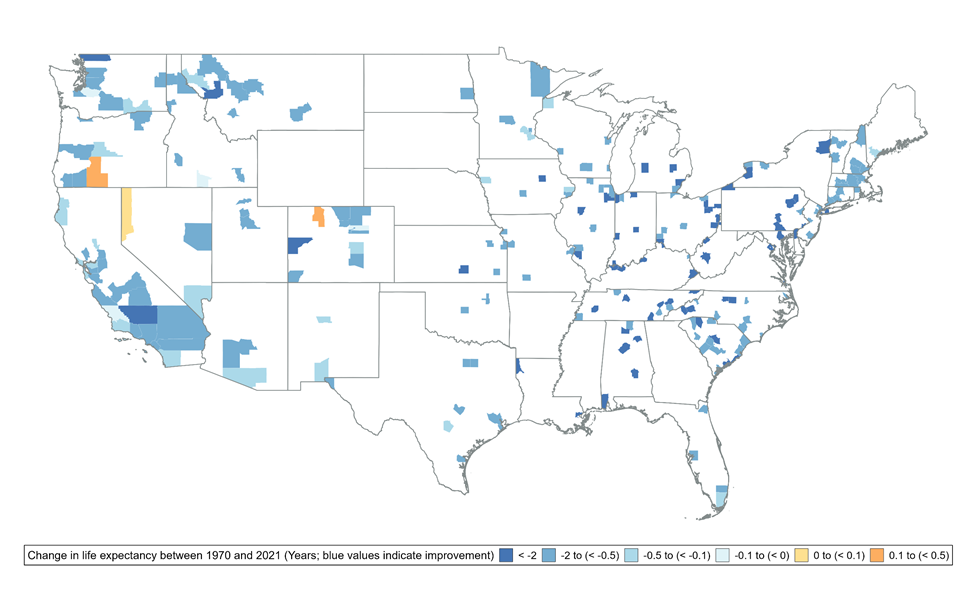
Only three counties (in orange in the figure below) are losing life years due to particulate pollution increasing in 2021 compared to 1970—Routt (Colorado), Washoe (Nevada), and Klamath (Oregon).
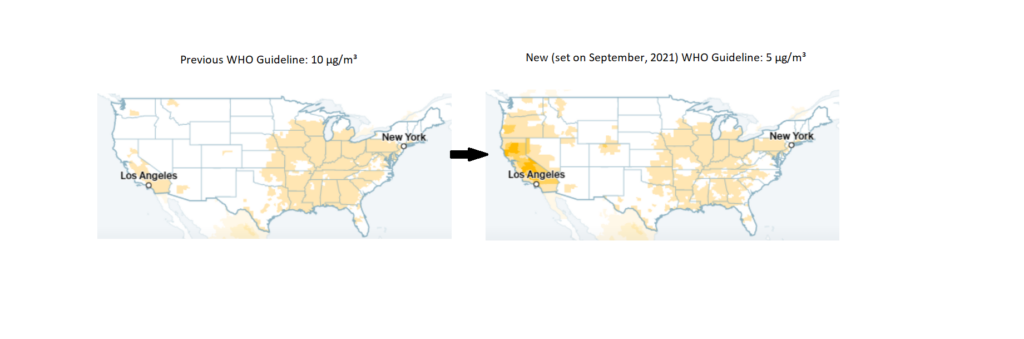
In September 2021, the World Health Organization revised its pollution guideline from 10 µg/m³ to 5 µg/m³. Now, 92.8 percent of the United States does not meet the new guideline. That is up from just 7.6 percent that did not meet the previous guideline (see figure below).
For details on how 1970 PM2.5 concentrations and life expectancy change due to particulate pollution reductions were estimated, see this Technical Appendix.[1] Also, refer the latest US factsheet and the US and Europe section of the AQLI Annual Report 2023.
- [1] Up until 1997, the Clean Air Act counted PM2.5 as included in either total suspended particulates or PM10. After that point, it became a separate indicator pollutant, with standards and a national monitoring network established.
- [2] For example, Chay and Greenstone (2005) find that in counties designated as nonattainment with respect to the Clean Air Act’s particulate matter concentration limits in the mid-1970s, the consequent decrease in particulate matter led to a significant rise in housing values by 1980. Shapiro and Walker (2018) find that the bulk of reductions in US manufacturing emissions from 1990-2008 are attributable to environmental regulations rather than changes in what the US is producing and importing or changes in manufacturing productivity.
- [3] To estimate particulate pollution changes since 1970, this analysis combines the AQLI’s pollution data with monitor data from the U.S. Environmental Protection Agency. For details on the methodology, see Technical Appendix linked above.
- [4] The E.P.A. monitoring network focuses on the most heavily populated or polluted areas of the country, which is why these calculations exclude approximately 110 million people.