AQLI News
September 5, 2022


September 5, 2022
#1 – Particulate Pollution is the Greatest Threat to Human Health Globally, Yet Funding to Tackle the Problem Lags
Global Trends in PM2.5 Concentrations, 2000-2020
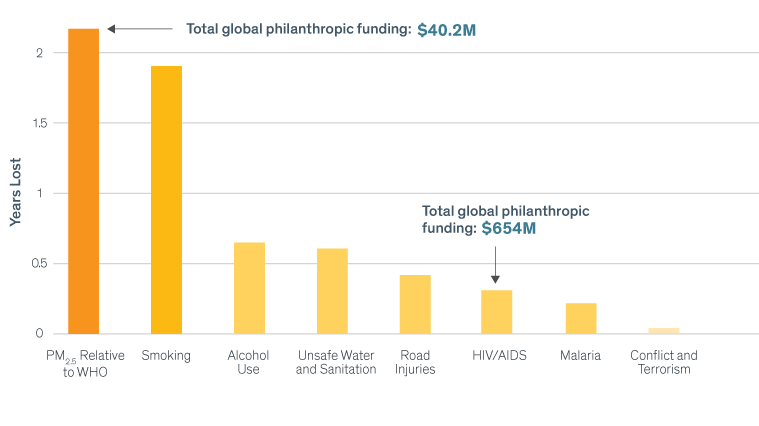
Particulate pollution takes 2.2 years off global average life expectancy, or a combined 17 billion life-years, relative to a world that met the WHO guideline. This impact on life expectancy is comparable to that of smoking, more than three times that of alcohol use and unsafe water, six times that of HIV/AIDS, and 89 times that of conflict and terrorism. Yet, investment in tackling air pollution lags far behind the scale of the problem. To put it into context, HIV/AIDS—which, after successful efforts instituted over decades, now has a smaller impact on global life expectancy—receives 16 times more financial support from philanthropies and 225 times more support from governments and international organizations than air pollution.
#2 – The Global Decline in Pollution in Recent Years is Due Entirely to China
Global Trends in PM2.5 Concentrations, 2000-2020
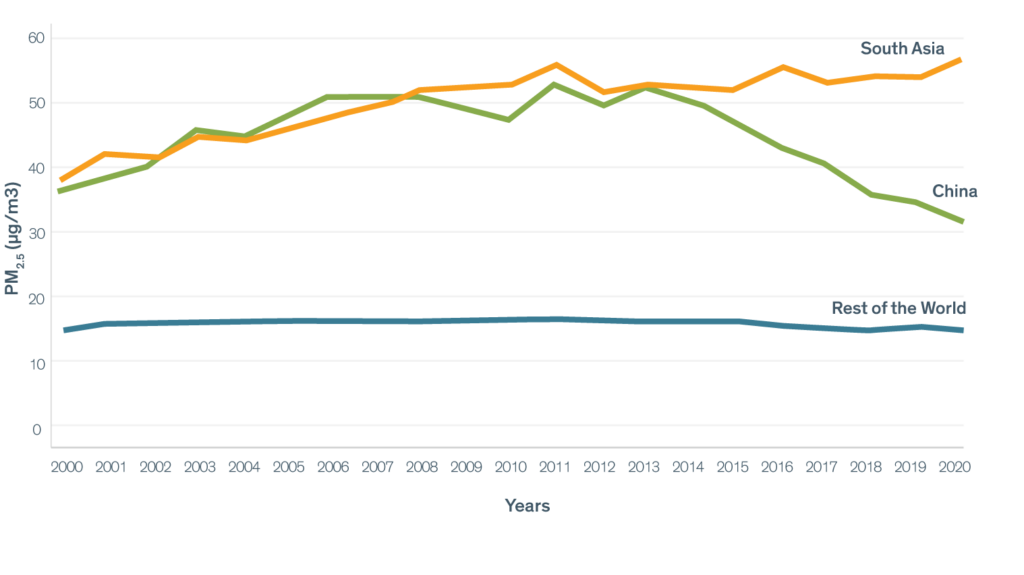
Over the past two decades, particulate pollution levels have remained largely unchanged for most of the world. But global average pollution has declined in recent years. That global decline is due entirely to China. Since declaring a “war against pollution” in 2013, pollution has declined by about 40 percent. Meanwhile, pollution has increased in industrializing countries of the developing world such as in South Asia. India, for example, accounts for 44 percent of the world’s increase in pollution since 2013. This has been the case as developing countries are burning high amounts of fossil fuels without the policy safeguards China and developed countries have imposed.
#3 – With Far Less Pollution Thanks to Strong Policy, Americans are Living Longer
Percentage of the U.S. Population Experiencing a Decrease in Average Life Expectancy, 1970 vs. 2020
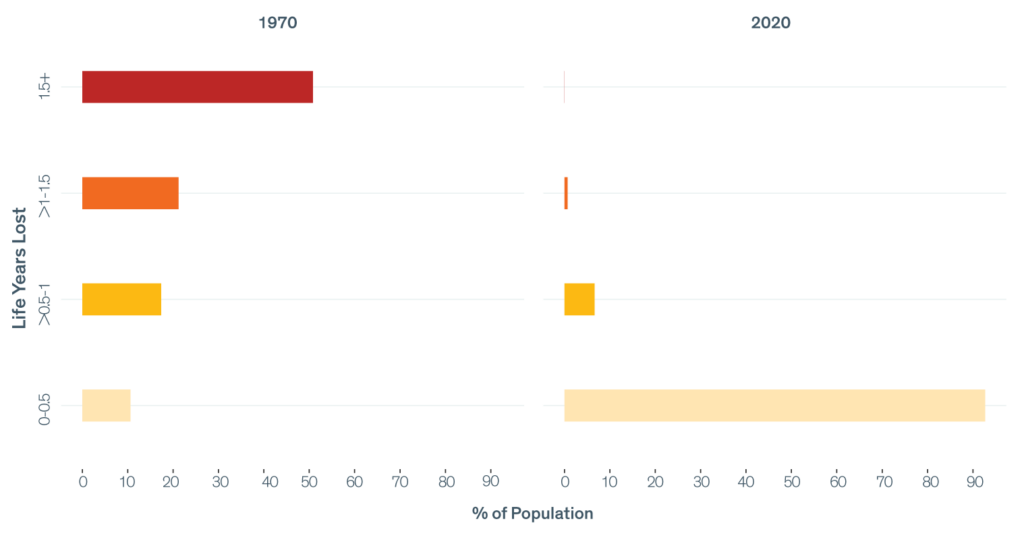
While wildfire-induced pollution has contributed to an uptick in specific sections of the United States, particulate pollution is generally not considered a major problem today. But, that wasn’t always the case. In 1970, more than half of the U.S. population was breathing air so polluted that, if sustained, they could have seen their lives cut short by 1.5 years or more. Another 38.6 percent could have been losing a half to 1.5 years off life expectancy, if sustained. Then came the Clean Air Act, which reduced pollution by about 67 percent. Today, just a small sliver of Americans experience pollution so bad that it’s cutting more than a year off their lives. Ninety-three percent are experiencing barely any or no life expectancy impact.
#4 – China has Quickly and Sharply Reduced Pollution Since Enacting Strict Policies
PM2.5 Concentrations in Major Regions in Mainland China Over Time
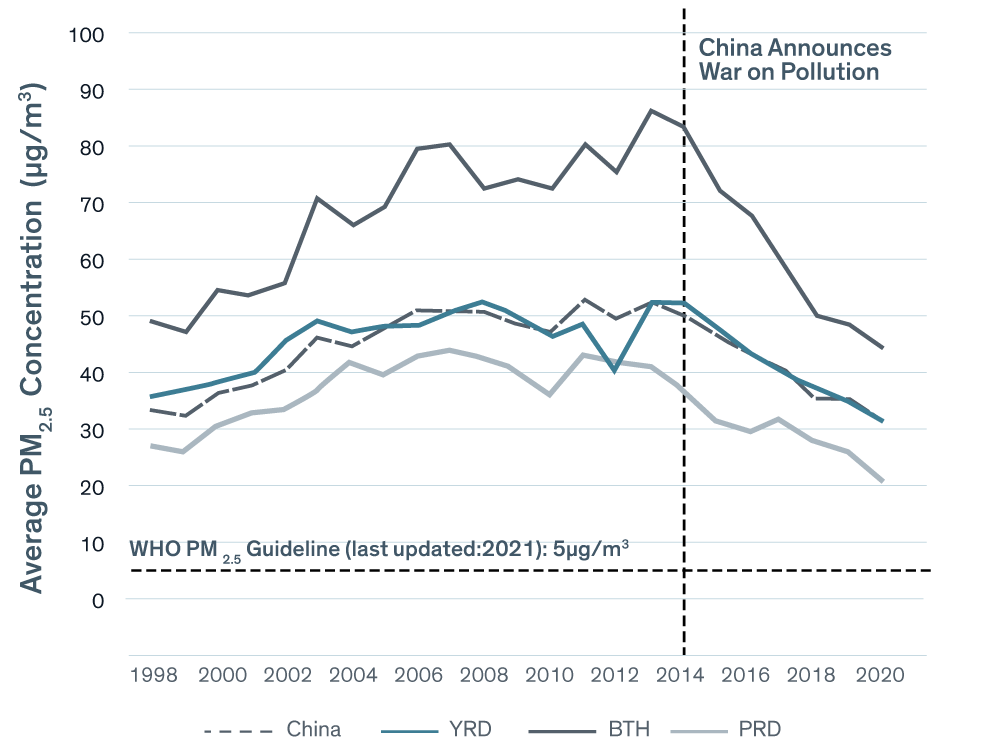
While the stubborn nature of the pollution challenge may seem daunting, China remains a beacon of progress. In 2013, China experienced record pollution, and public awareness and criticism reached new heights. The following year, China declared a “war against pollution,” allocating substantial public resources to combating pollution. China’s strict policy action led to a swift reduction in pollution. From 2013 to 2020, particulate pollution in China declined by 39.6 percent, adding about 2 years onto average life expectancy, if the reductions are sustained. Beijing experienced the largest decline with concentrations falling 55 percent decline, adding 4.6 years onto lives, if sustained.
#5 – Wildfire-Ravaged California is Home to 29 of the Top 30 Most Polluted Counties
Particulate Pollution (PM2.5) Concentrations in the United States, 2020
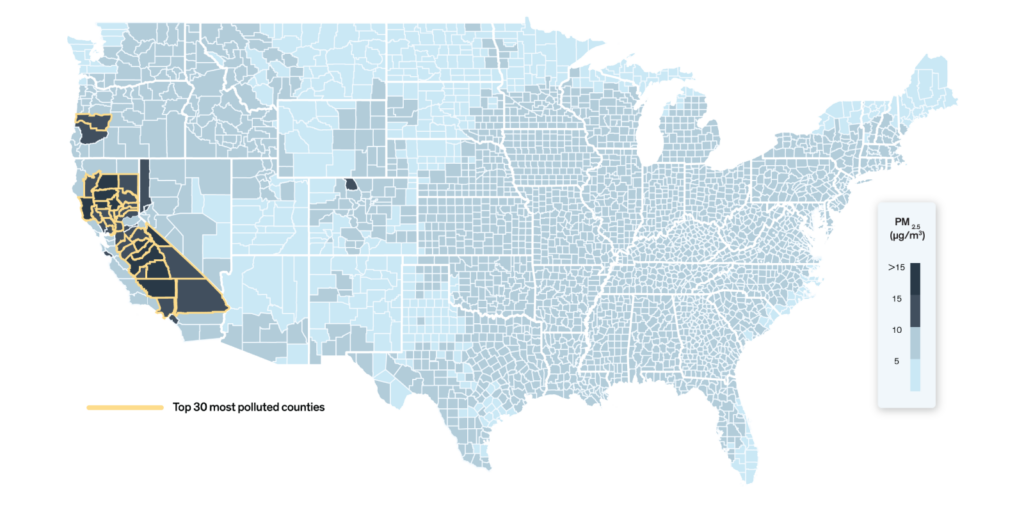
California leads the nations as the most polluted state thanks mostly to catastrophic wildfires. Out of the top 30 most polluted U.S. counties, 29 of them were in California in 2020. Indeed, some counties are now more polluted than they were in 1970, before policy existed to reduce pollution. The pollution levels, if sustained, are set to shave nearly a year off the life expectancy of residents on average in each of those 29 counties. The most polluted county was Mariposa, where pollution shot up to double the amount experienced in 2018 when it hit a record high level. If this high pollution continues, Mariposa residents could see their lives cut short by 1.7 years on average.
#6 – Countries Lacking National Air Pollution Standards are Shortening the Lives of Their People
Countries with the Largest Health Burden Due to Air Pollution and No National Air Quality Standards Embedded in Legislative Instruments
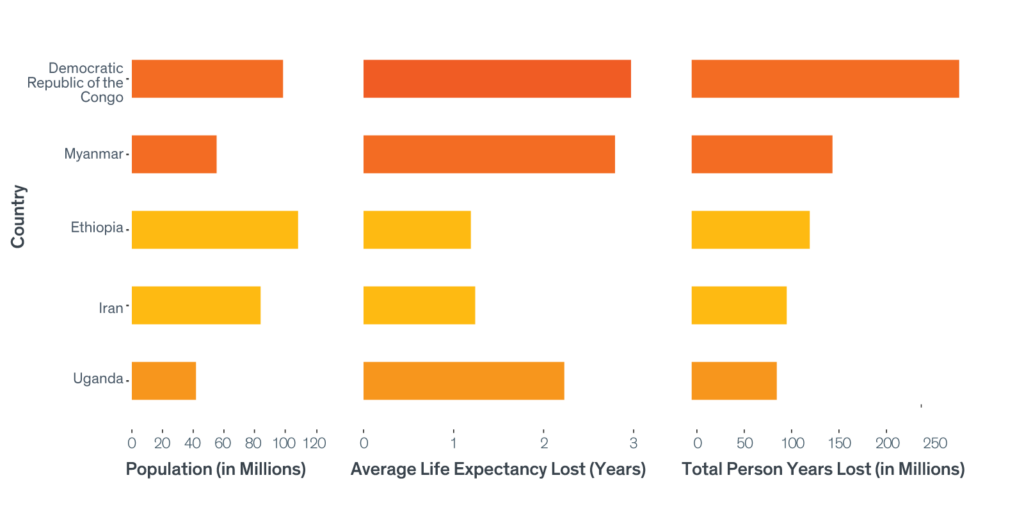
Enforceable national air quality standards are essential for reducing pollution. Yet, some of the most polluted countries in the world lack them, such as the fifth most polluted, the Democratic Republic of the Congo (DRC), and seventh most polluted, Myanmar. If the DRC and Myanmar achieved air quality standards that met the stringency of the World Health Organization’s guideline, their residents would gain 2.9 and 2.7 years in life expectancy, respectively. Along with the DRC and Myanmar, Ethiopia, Iran and Uganda round out the top five countries with no legally-embedded national standards that would see the most benefits from cleaner air. Unless actions are taken to reduce fossil fuels and install strong, enforceable air standards, pollution will only become a greater problem in these countries.
#7 – The Most Polluted Region on Earth is Seeing Air Quality Worsen at an Alarming Rate, Increasing Health Disparities
Average PM2.5 Concentrations in India, 1998 to 2020
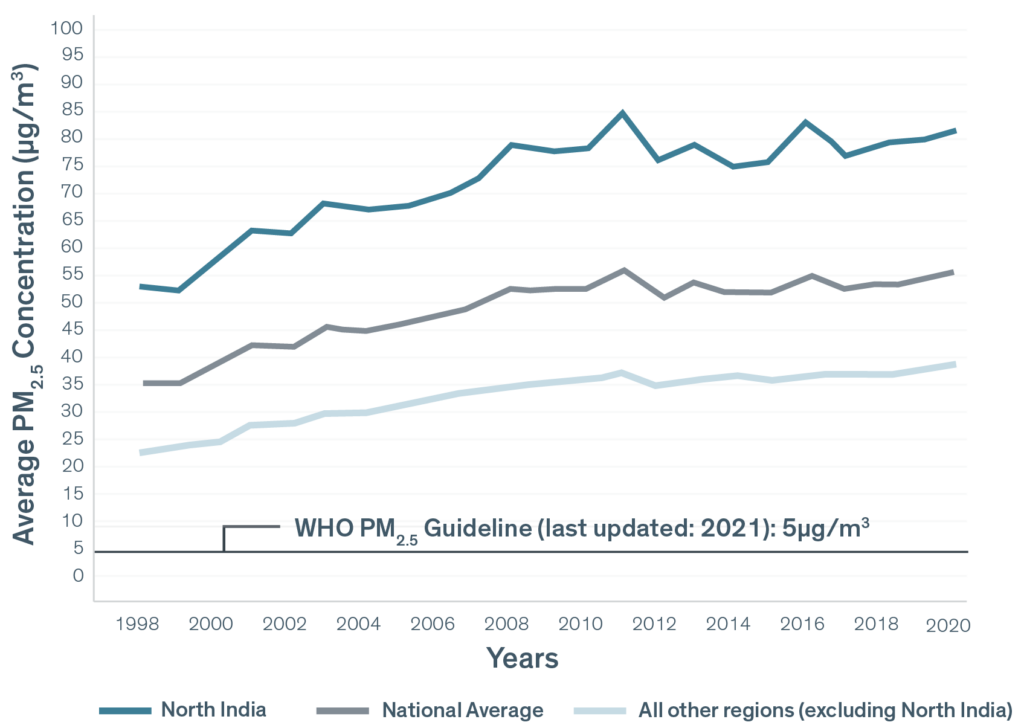
Across India, pollution has been on the rise over the last 22 years, with no region escaping that increase. But the residents of northern India have experienced the worst pollution on earth, cutting 7.6 years off their lives—far more than the 3.3 years of life expectancy all other Indians would lose. That disparity has only grown over time. In 1998, northern residents saw their lives cuts short by 3 more years than everyone else. By 2020, a 42 percent increase in the pollution gap had caused the lives of those in the north to be cut short by 4.3 more years compared other Indians.
#8 – Eastern Europeans are Living Shorter Lives Than Their Western Neighbors Due To Air Pollution
Comparison of Life Expectancy Lost Due to Particulate Pollution Not Meeting the WHO Guideline
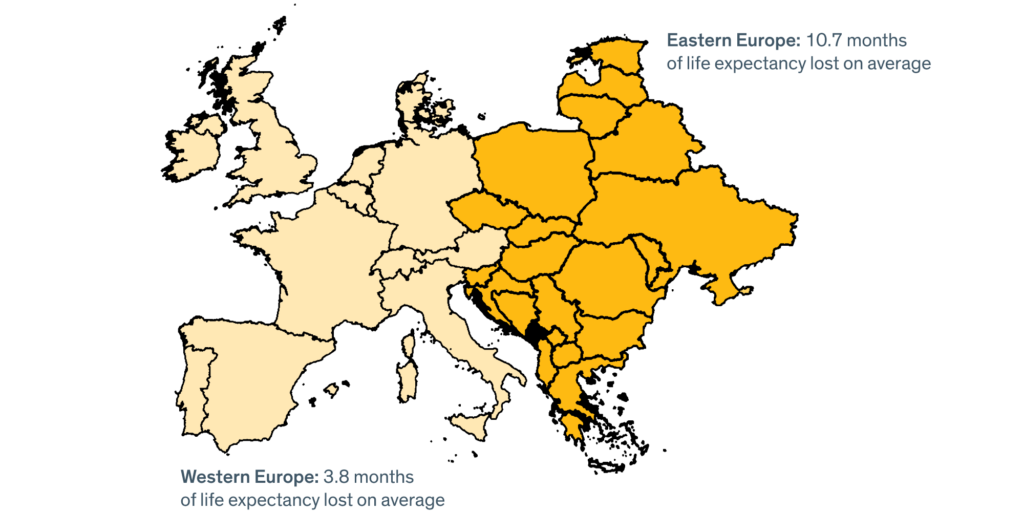
Europeans today are breathing starkly different air, with the west generally less polluted than the east. Residents of eastern Europe are losing 10.7 months of life expectancy on average due to air pollution compared to 3.8 months lost in the west. The differences are even more poignant when comparing neighbors. Germans are losing just months off their lives while Poles are losing a full year. Residents of Bosnia and Herzegovina are losing almost 2 years off their lives due to air that is more comparable to countries in Southeast Asia than to nearby Austria where there is half as much pollution.
#9 – Air Pollution is as Much of a Threat as Communicable Diseases in West Africa
Life Expectancy Impacts of Particulate Pollution and Other Health Threats in the Four Most Populous Countries in West Africa
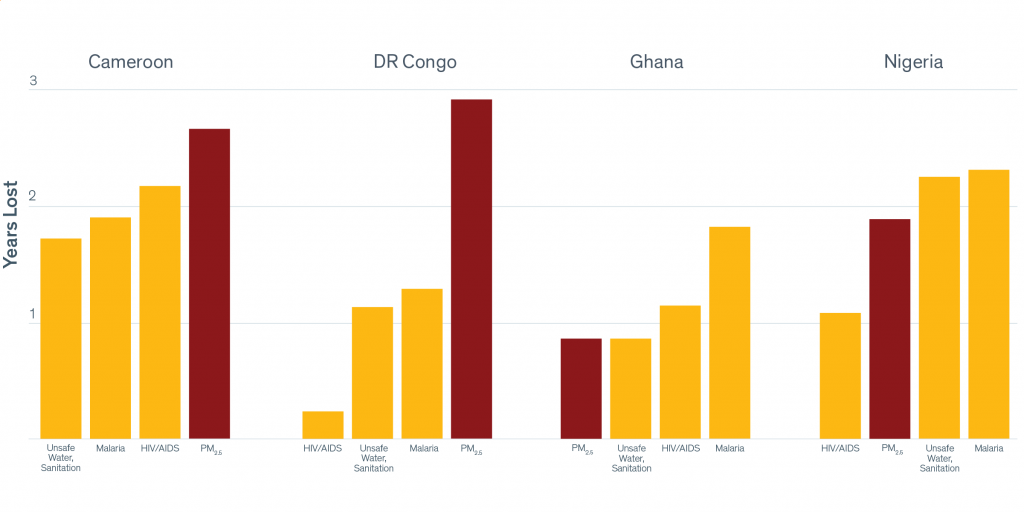
The health focus in Sub-Saharan Africa has centered on infectious diseases like HIV/AIDS and malaria, which receives about 10 percent of health expenditures in the region. But the Air Quality Life Index (AQLI) shows that particulate pollution—often ignored as a problem—impacts life expectancy in a comparable and sometimes more devastating way than these other causes. That is certainly the case in the Democratic Republic of the Congo (DRC)—the most polluted country in the region and fifth most polluted globally—where particulate pollution in 2020 was nearly 7 times higher than the World Health Organization guideline. As a result, the average resident of the DRC is losing 2.9years off their life expectancy. That’s compared to just 3.6months due to HIV/AIDS. Across Central and West Africa—home to more than 600 million people living in 27 countries —the average person is set to lose 1.6 years off their lives if the current levels of pollution persist. Assuming business as usual, the situation could worsen as energy demands are expected to triple across the African continent by 2030. And yet, only Cameroon has set a national standard for particulate pollution. Further, as of 2019, only a handful of real-time air quality monitoring stations exist throughout the entire region, resulting in a lack of transparent and actionable pollution data. In comparison, about 200 real-time monitors exist in India, which has a smaller land mass than Central and West Africa. The lack of data transparency is a major hindrance to policy action.
#10 – Even a Pandemic-Induced Economic Slowdown Couldn’t Slash Stubborn Global Air Pollution
Year-Over-Year Change in PM2.5 Levels in 2020, the First Year of the Pandemic
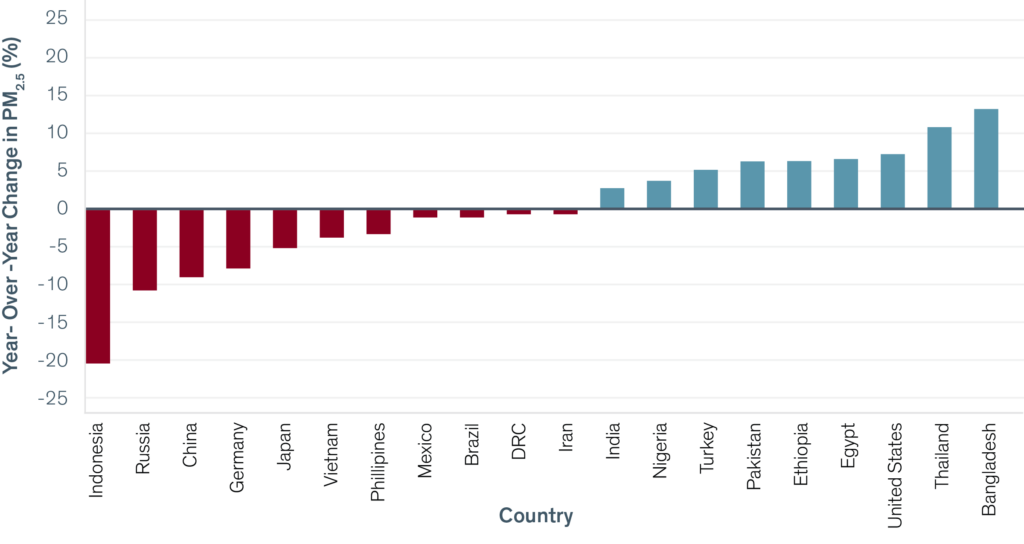
During the first year of the Covid-19 pandemic, the world’s economy slowed. Yet, the global annual average particulate pollution (PM2.5) was largely unchanged from 2019 levels. In some of the most polluted regions of the world, like South Asia and parts of Southeast Asia, pollution rose. Other regions, like China, saw a continued decrease thanks to their multi-year effort to confront the problem; while fewer large fire events in parts of Southeast Asia contributed to decreases there. The fact that pollution levels largely remained flat, or even increased, even as economies stalled across the world, underscores that pollution is a stubborn problem.